This is a project that I worked on for Midway ISD in Waco, TX to help report positive COVID-19 cases in their district.
Using Microsoft 365 applications, I designed an infrastructure that allows campus nurses to input positive COVID-19 cases each day which updates the dashboard on the website on a daily basis.
Microsoft Power BI was used to create the dashboard, as seen in the screenshot below.
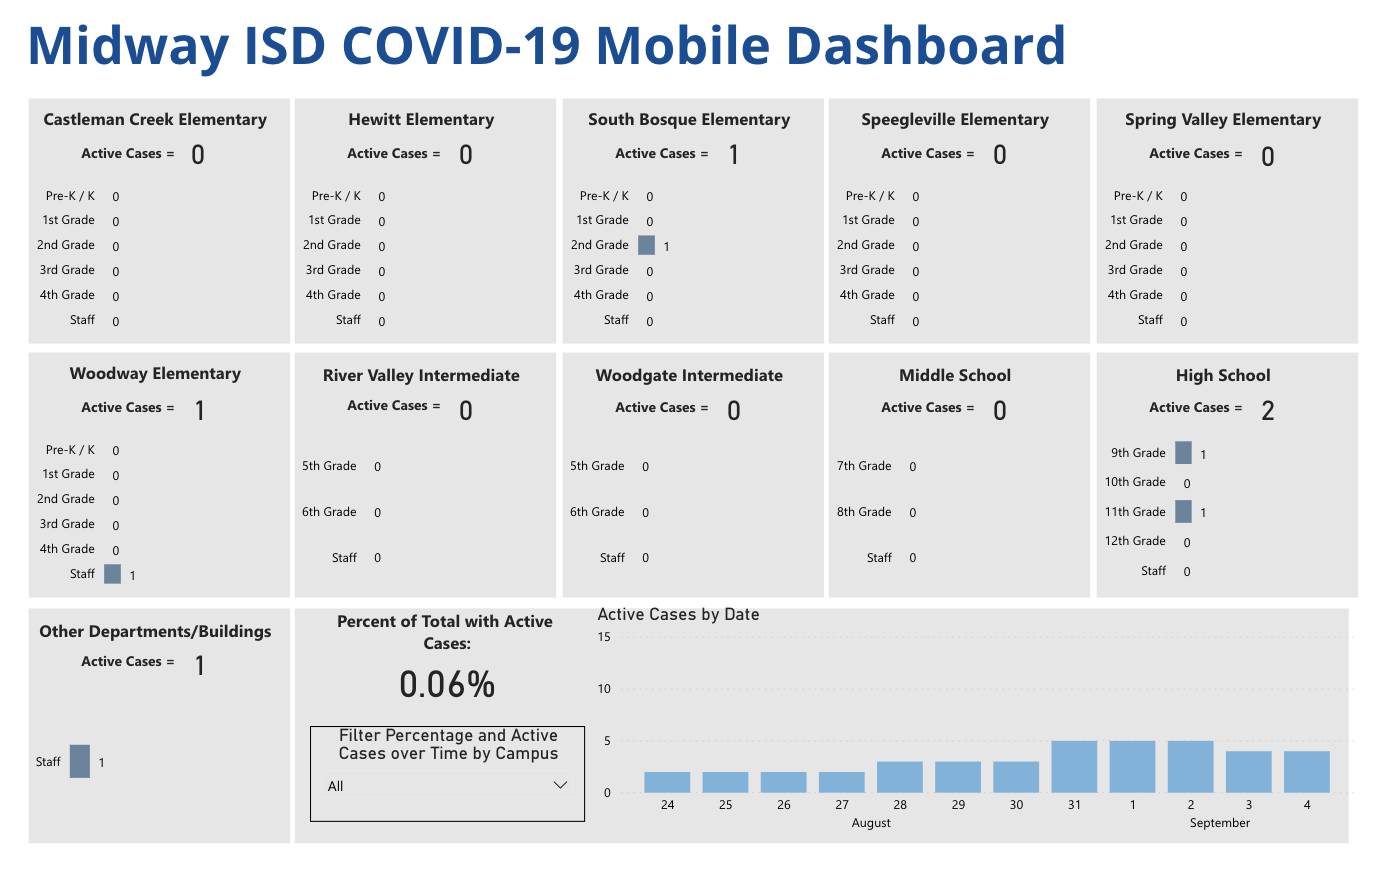
The following are the key components of this dashboard:
- Each campus has the current positive COVID-19 test amounts shown by grade level in individual bar charts. Both student and staff numbers are shown as well as a total Active Case count for the entire campus.
- A percentage of total population with active cases is given as well and users can filter this percentage by campus if wanted.
- The final component of the dashboard is a timeline of active cases by date. Users can use the same filter as the percentage to filter the timeline by campus.
In order to ensure that Midway ISD did not have to manually update the dashboard, I set up the infrastrucutre so that after campus nurses input the daily active cases, everything is updated automatically. It was decided to schedule the Power BI refresh for each morning before school starts so that parents can make the best decision on whether to keep their child(ren) home or not.
This project was a pleasure to work on and it has helped parents, teachers and staff to make the best decision on whether to keep class in-person or move to a virtual solution.
